Display custom data on 2D map
In this guide I will show how to overlay custom rectangles on Map2D. It supports colors and opacity as well. We will need to:
There are no prerequisites for this tutorial except for Getting started Tutorial.
Writing .mzrt.csv file
All you need is a delimited file of a very simple format. It should be a UTF-8 delimited text file with column headers. Delimiter character is auto-detected, allowed chars are tab (\t), comma and space. The file can contain any columns you like, however it MUST contain the following columns:
- mzLo
- mzHi
- rtLo
- rtHi
RT is specified in minutes. This is enough information to draw a rectangle over Map2D. Optionally you can also provide:
- color (must be a valid hex value, e.g. #FF0000 for red)
- opacity (in the range [0.0 - 1.0])
Example .mzrt.csv file
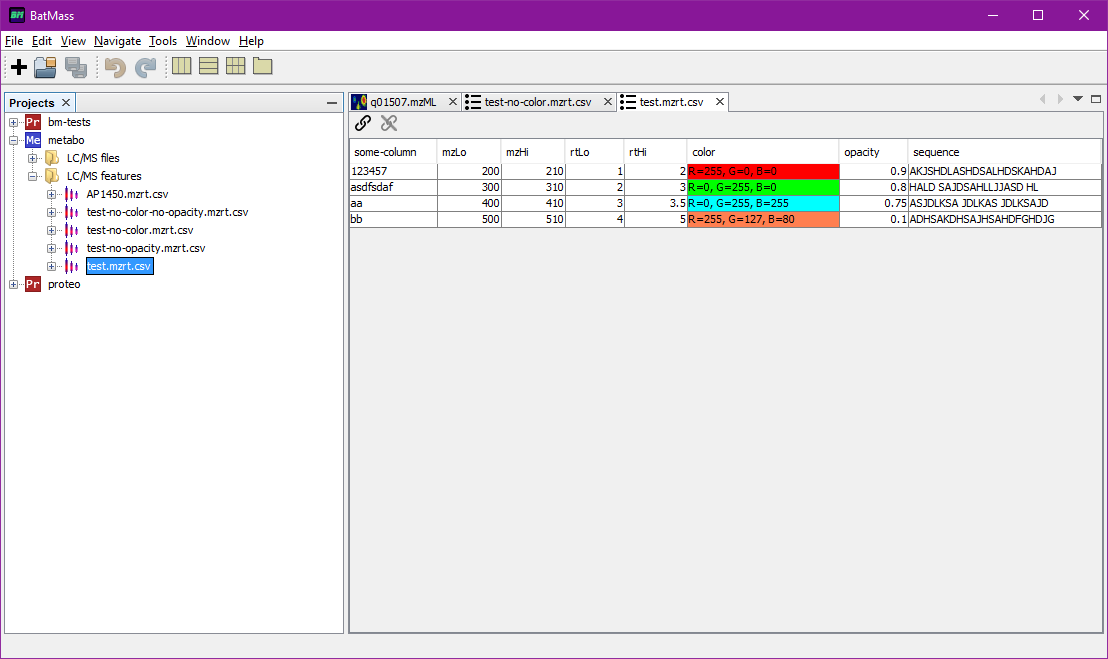
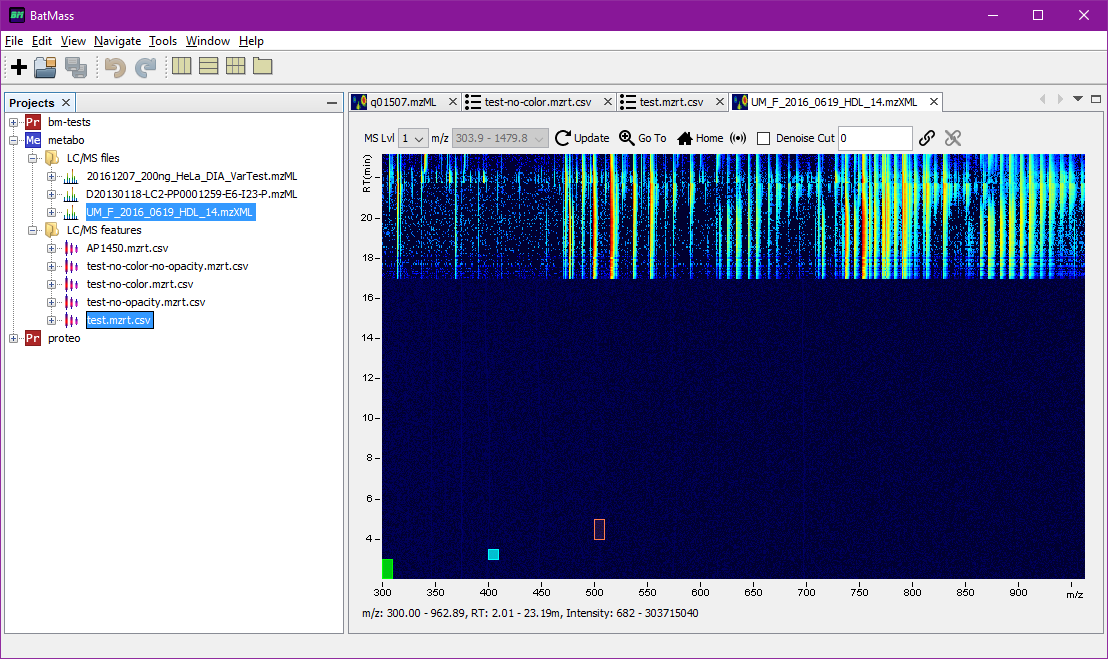
We will use this file in the example below. Note that the red rectangle was out of range of in m/z dimension (the LC/MS file only had m/z valus starting from 300, however the red rectangle calls for 200-210 range).
some-column,mzLo,mzHi,rtLo,rtHi,color,opacity,sequence
123457,200,210,1,2,#FF0000,0.9,AKJSHDLASHDSALHDSKAHDAJ
asdfsdaf,300,310,2,3,#00FF00,0.8,HALD SAJDSAHLLJJASD HL
aa,400,410,3,3.5,#00FFFF,0.75, ASJDLKSA JDLKAS JDLKSAJD
bb,500,510,4,5,#ff7f50,0.1,ADHSAKDHSAJHSAHDFGHDJG
How it should look like

 Notice how the orange rectangle had opacity 0.1, thus only its border is visible and the contents is
transparent.
Import the file to LC/MS Features section
In any project right-click LC/MS Features node and select Import. You should be able to add
any file that has double-extension .mzrt.csv.
Display in a table or overlay on 2D map
To display the tabular view right-click the imported file, select View -> Table. The table can be sorted by one or multiple columns. To sort by multiple columns hold Shift when clicking
on column headers.
To overlay data on 2D map, select both files simultaneously (the .mzrt.csv file and the LC/MS file)
to overlay onto, right-click any of them, there should be an option to Overlay on 2D Map in the context menu.
You can now link the Map2D with Table viewer by dragging the link icon
![]() from the toolbar of Map2D to the link icon
from the toolbar of Map2D to the link icon
![]() in the Table view toolbar. Now double-clicking
on a row in the table will automatically zoom the Map2D to the corresponding region.
in the Table view toolbar. Now double-clicking
on a row in the table will automatically zoom the Map2D to the corresponding region.